The Nifty index is showing a strong bullish trend, characterised by a consistent higher top higher bottom formations on monthly charts that suggests an enduring positive sentiment for the long term.
On the weekly charts, profit-booking is evident at higher levels, with the index sustaining at a three-week low, albeit respecting its significant support level of the 13-week EMA (exponential moving average) after a brief correction.
On lower time frames such as daily charts, the index is moving within an upward sloping channel pattern, nearing its important support zone at the lower edge of the channel pattern.
In terms of levels, immediate resistance is notable at 22,500, a significant level on higher time frames, with further resistance seen at 22,780 and 23,170. Conversely, crucial support levels are identified at 21,700 and 21,500.
Considering the prevailing chart patterns, a prolonged bullish phase is anticipated for the longer term. Consequently, it is advisable to seek buying opportunities near the support level, with potential upside targets ranging from 22,500 to 22,780. To effectively mitigate risk, implementing a strict stop-loss strategy at 21,700 on a closing basis is recommended.
Here are three buy calls for short term:
Samvardhana Motherson International: Buy | LTP: Rs 126 | Stop-Loss: Rs 116 | Target: Rs 152 | Return: 20 percent
Samvardhana Motherson is currently displaying robust momentum, trading at its 52-week high. Notably, its weekly price structure is impressive, having rallied from March 2020 to June 2021. Following this rally, it underwent a healthy retracement, showing a pullback from a double bottom formation near the 61.80 Fibonacci ratio of the prior up move. Subsequently, it continued to form higher tops and higher bottoms, indicating potential upside momentum.
The stock has consistently remained above key moving averages such as the 20-weekly and 50-weekly, affirming a positive trend. Moreover, the ADX (average directional index) study above 25, along with +DI above 30, reinforces the bullish momentum.
In addition, comparing Samvardhana Motherson against the Nifty on a ratio chart reveals a breakout of a prior downward sloping trend line connecting from 2017. This breakout suggests outperformance and indicates continued strength relative to the broader market index.
Going ahead we expect the prices to go higher till the level of Rs 152. the bullish view will be negated if we see prices sustaining below Rs 116 level.
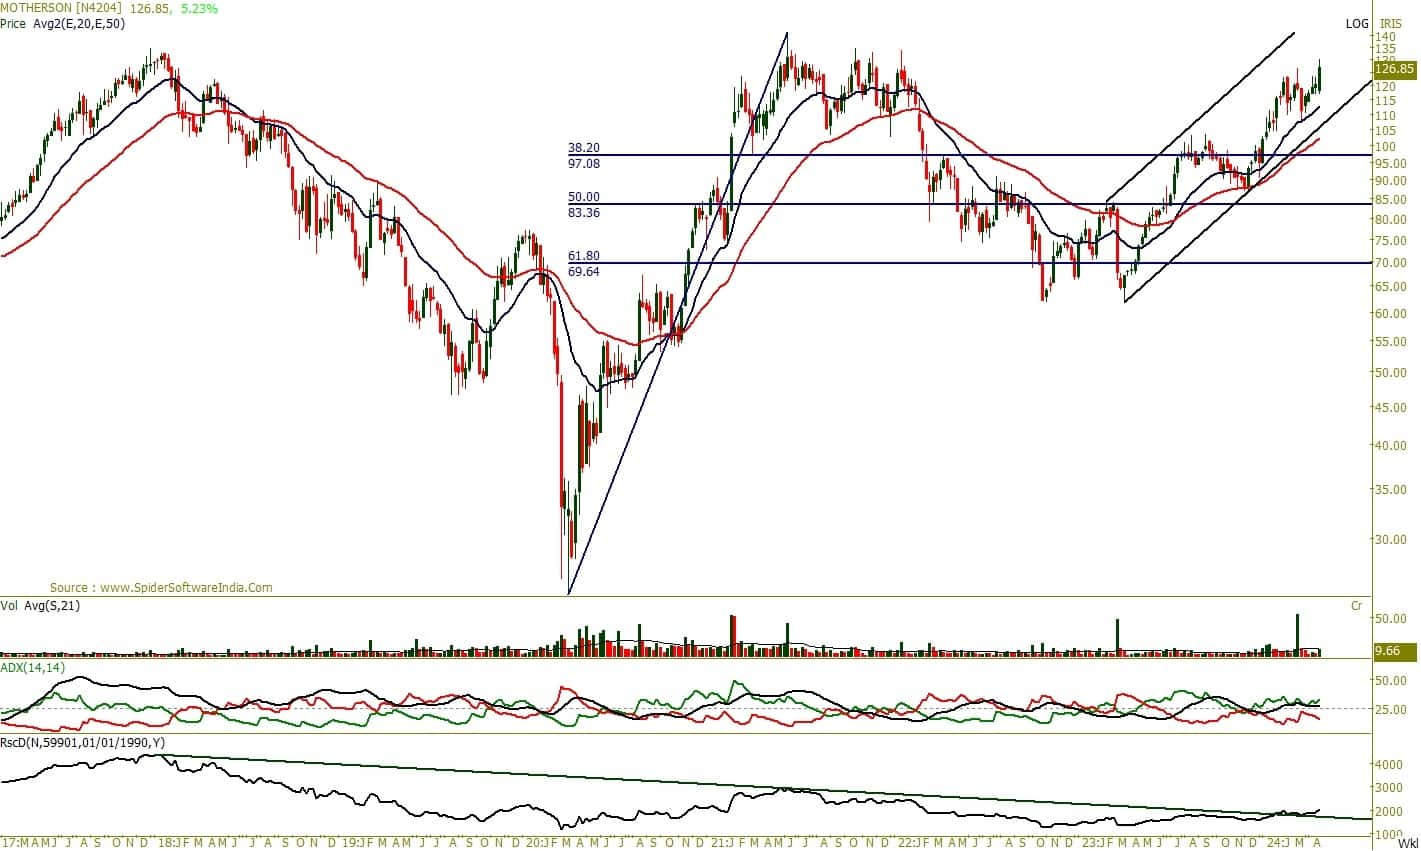
Image1218042024
Bharti Airtel: Buy | LTP: Rs 1,266 | Stop-Loss: Rs 1,163 | Target: Rs 1,480 | Return: 17 percent
Bharti Airtel is currently hitting its highest point ever, demonstrating robust momentum in its price structure since 2018. On the daily scale, the stock recently broke out of a consolidation phase spanning approximately 20 days, accompanied by strong volume participation.
Moreover, Bharti Airtel remains above significant moving averages like the 20-week and 50-week EMAs (exponential moving average), signaling a positive trend. The ADX study on the weekly scale is above 50, with a range shift in the +DI range indicating the continuation of bullish momentum and trend strength.
Additionally, the ratio chart of Bharti Airtel against the Nifty indicates sustained outperformance as the ratio line continues its upward trajectory.
Going ahead, we expect the prices to go higher till the level of Rs 1,480. The Bullish view will be negated if we see prices sustaining below Rs 1,163 level.
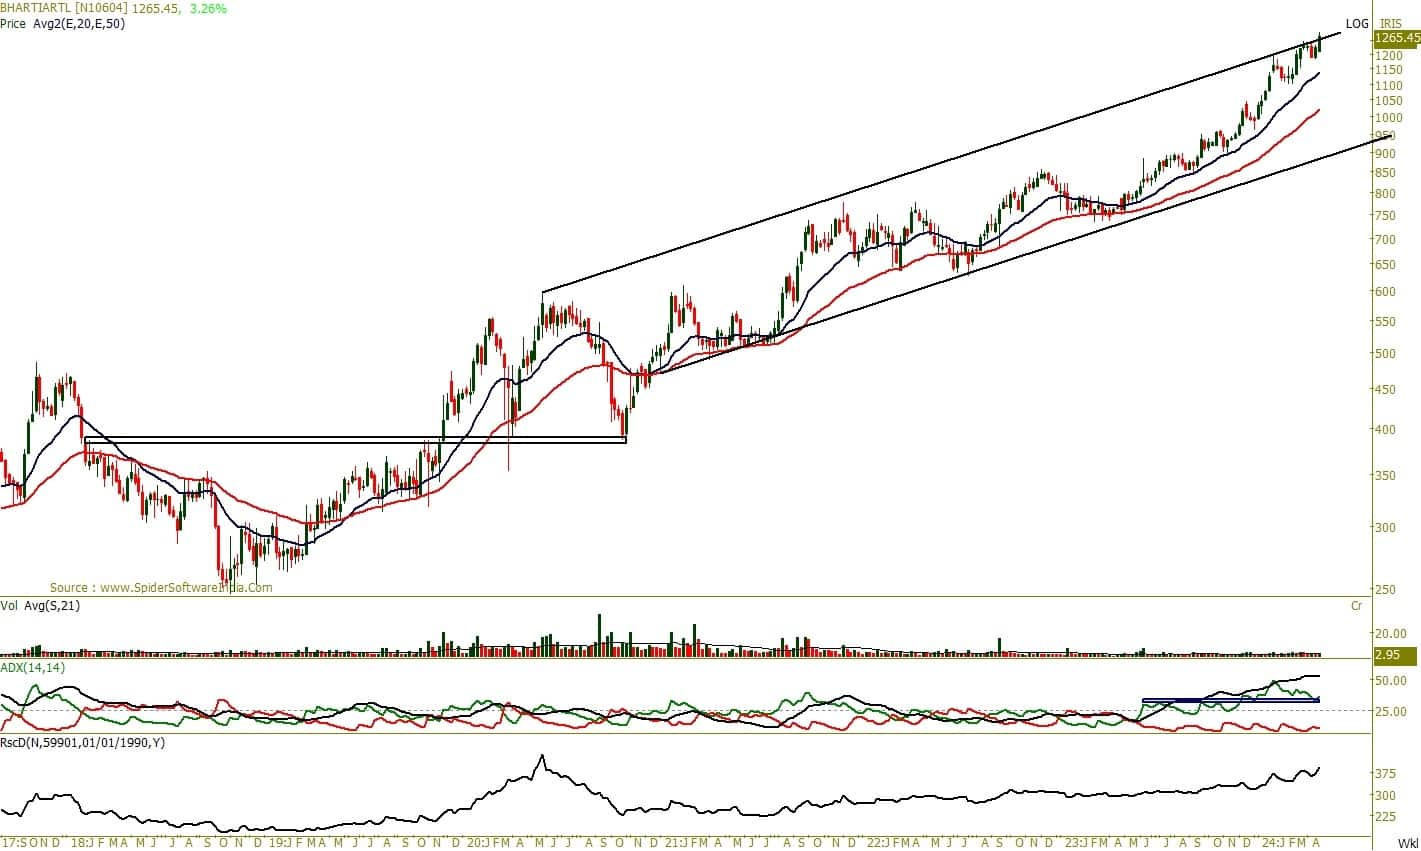
Image1318042024
Tata Power Company: Buy | LTP: Rs 430 | Stop-Loss: Rs 400 | Target: Rs 528 | Return: 22 percent
Tata Power has been on an upward trajectory since May 2020 until April 2022. After a gradual decline with slow momentum, it broke out of a sloping trend line in May 2023, continuing its upward trajectory.
Consistently trading above its 20-week and 50-week EMAs, and with the RSI consistently above 60 across various timeframes, the stock demonstrates robust bullish momentum.
Furthermore, the ratio chart of Tata Power against the Nifty has been trending higher since August 2023, forming higher highs and higher lows, indicating continued outperformance.
Looking ahead, it’s reasonable to anticipate continued upward movement in the stock, with a potential target price of Rs 528. It’s advisable to set a stop-loss at Rs 400 on a closing basis to manage risk effectively.
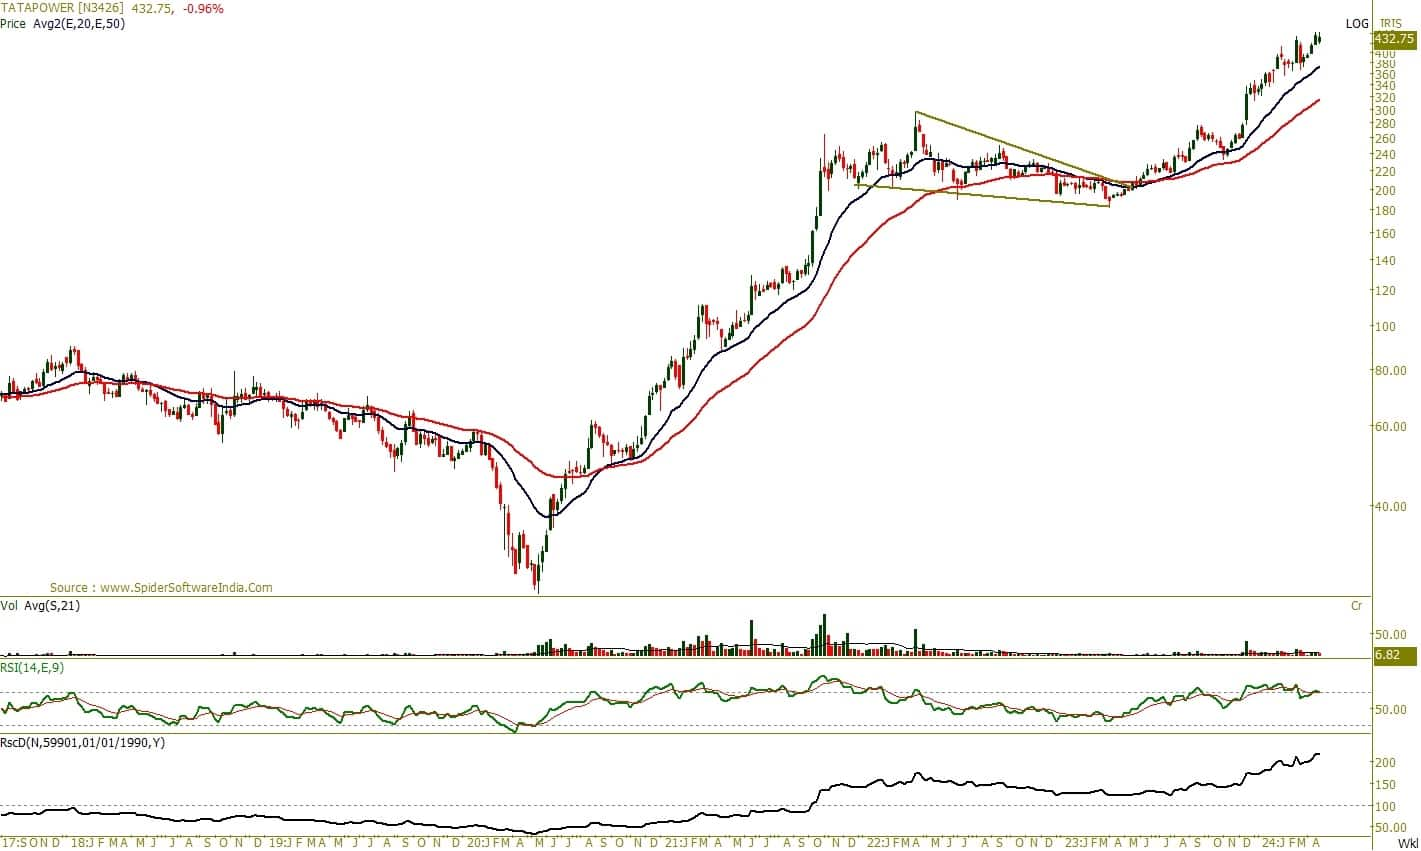
Image1418042024
Disclaimer: The views and investment tips expressed by investment experts on Moneycontrol.com are their own and not those of the website or its management. Moneycontrol.com advises users to check with certified experts before taking any investment decisions.
News Related-
Anurag Kashyap unveils teaser of ‘Kastoori’
-
Shehar Lakhot: Meet The Intriguing Characters Of The Upcoming Noir Crime Drama
-
Watch: 'My name is VVS Laxman...': When Ishan Kishan gave wrong answers to right questions
-
Tennis-Sabalenka, Rybakina to open new season in Brisbane
-
Sikandar Raza Makes History For Zimbabwe With Hattrick A Day After Punjab Kings Retain Him- WATCH
-
Delayed Barapullah work yet to begin despite land transfer
-
Army called in to help in tunnel rescue operation
-
FIR against Redbird aviation school for non-cooperation, obstructing DGCA officials in probe
-
IPL 2024 Auction: Why Gujarat Titans allowed Hardik Pandya to join Mumbai Indians? GT explain
-
From puff sleeves to sustainable designs: Top 5 bridal fashion trends redefining elegance and style for brides-to-be
-
The Judge behind China's financial reckoning
-
Arshdeep Singh & Axar Patel Out, Avesh Khan & Washington Sundar IN? India's Likely Playing XI For 3rd T20I
-
Horoscope Today, November 28, 2023: Check here Astrological prediction for all zodiac signs
-
'Gurdwaras are...': US Sikh body on Indian envoy's heckling by Khalistani backers