Is the Stock Market Going to Crash? 153 Years of Valuation History Weighs In and Provides a Big Clue.
Since 2023 began, Wall Street has been firing on all cylinders. In this roughly 17.5-month stretch, we've watched the mature stock-driven Dow Jones Industrial Average (DJINDICES: ^DJI) gain 17%, the benchmark S&P 500 (SNPINDEX: ^GSPC) add 42%, and the growth-fueled Nasdaq Composite (NASDAQINDEX: ^IXIC) catapult higher by 69%. More importantly, all three indexes have achieved record-closing highs and firmly established themselves in bull markets.
On paper, things have been going swimmingly for Wall Street. A majority of S&P 500 components are topping consensus profit expectations, and the U.S. economy has remained on track. Despite a few historically accurate predictive indicators calling for a U.S. recession in 2023, the economy continues to chug along.
But history also tells us that the stock market rarely moves up in a straight line for any extended period. While hype surrounding artificial intelligence (AI) is, undeniably, giving stocks a boost, it doesn't remove the possibility of equities crashing back to Earth at some point in the future.

A twenty dollar bill paper airplane that's crashed and crumpled into the business section of a newspaper.
Even though there's no such thing as a foolproof metric when it comes to predicting short-term directional moves in the Dow, S&P 500, and Nasdaq Composite, certain predictive tools have uncanny track records of correlating with big moves in the stock market throughout history. One such valuation indicator, which has 153 years of data in its sails, offers a big clue as to whether or not the stock market is going to crash.
Are stocks heading for disaster?
Over the last year, I've looked at an assortment of predictive tools that have strongly correlated with sizable directional moves in Wall Street's three major stock indexes. These include U.S. M2 money supply, the ISM Manufacturing New Orders Index, and the Conference Board Leading Economic Index (LEI), to name a few.
But if there's one metric that has an extensive track record of foreshadowing big moves on Wall Street above all others, it's the valuation-driven Shiller price-to-earnings (P/E) ratio, which is also commonly referred to as the cyclically adjusted price-to-earnings ratio or CAPE ratio.
With a traditional P/E ratio, a company's share price is divided into its trailing 12-month earnings per share. However, the S&P 500's Shiller P/E ratio is based on average inflation-adjusted earnings over the previous 10 years. Examining a decade's worth of earnings data helps remove one-off events, such as COVID-19, which can adversely affect valuation analysis.
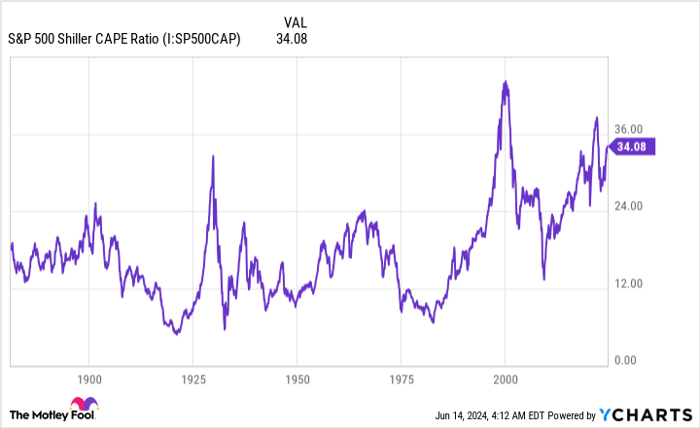
As of the closing bell on June 13, the S&P 500's Shiller P/E stood at 35.38. When back-tested to the start of 1871, this represents one of the highest-ever readings during a bull market rally. It's also more than double the average reading over the last 153 years of 17.13 -- although ease of access to public data (thanks, internet!) and a period of historically low interest rates certainly encouraged risk-taking and earnings multiple expansion over the last 30 years.

S&P 500 Shiller CAPE Ratio
However, the Shiller P/E ratio being more than twice its historic average isn't the biggest concern. Rather, it's what's followed every instance of the S&P 500's Shiller P/E topping 30 during a bull market rally:
- August 1929-September 1929: Immediately prior to the Great Depression taking hold in America, the Shiller P/E topped 30 for the first time. The Dow would subsequently lose 89% of its value before finding its bottom.
- June 1997-August 2001: During the dot-com bubble, the S&P 500's Shiller P/E hit its all-time high above 44. This was followed by the S&P 500 losing 49% of its value and the Nasdaq Composite shedding in excess of 75% from its peak.
- September 2017-November 2018: A fourth-quarter swoon of 20% in the S&P 500 followed yet another instance of a prolonged rally pushing the Shiller P/E north of 30.
- December 2019-February 2020: In the months leading up to the COVID-19 crash, the Shiller P/E surpassed 30. The S&P 500 would lose 34% of its value in 33 calendar days during the 2020 COVID-19 crash.
- August 2020-May 2022: During the first week of January 2022, the Shiller P/E hit 40 for only the second time in its back-tested history. During the 2022 bear market, the S&P 500 would lose up to 28% of its value, with the Nasdaq getting hit even harder.
- November 2023-current: As noted, the Shiller P/E is currently above 35, as of the closing bell on June 13, 2024.
The Shiller P/E ratio has surpassed 30 six times in 153 years, and the previous five instances were all associated with pullbacks in the S&P 500, Dow, or Nasdaq Composite ranging from 20% to as much as 89%. Based on what history has told us about extended valuations, a meaningful move lower -- and perhaps even a short-lived "crash" -- may await.
Just keep in mind that the Shiller P/E isn't a timing tool. As you'll note from the dot-com bubble, stocks remained exceptionally pricey for more than four years. The current priciness of the stock market could continue for weeks, months, or years to come before rolling over, as history suggests will happen.

Hand holding stylus over rapidly rising stock chart displayed on a tablet.
History is a two-sided coin that strongly favors the long-term optimist
The prospect of a bear market or a stock market crash probably isn't something you want to hear with the Nasdaq Composite, S&P 500, and Dow Jones Industrial Average in full rally mode. But the good news I have to offer is that history is non-linear, and very much in the corner of optimistic investors who put their money to work with a long horizon in mind.
To be fair, nothing we do, say, or think as investors can prevent economic recessions or occasional downturns (corrections, bear markets, or crashes) in the stock market from occurring. These declines are a natural part of the economic cycle and long-term investing.
However, there's a marked difference between periods of growth for the U.S. economy and contractions. Since World War II ended in September 1945, nine of the 12 U.S. recessions have resolved in less than 12 months. Of the remaining three, none lasted longer than 18 months.
On the other side of this disproportionate coin, most economic expansions have endured for many years. In fact, two periods of growth since the end of World War II surpassed the 10-year mark. If you're an investor, betting on the U.S. economy to expand over time has absolutely been the right move.
We see these same disparities between bear and bull markets on Wall Street, as well.
One year ago, the researchers at Bespoke Investment Group published a data set on X, the social media platform formerly known as Twitter, which examined the calendar length of every bear and bull market in the S&P 500 since the start of the Great Depression in September 1929. This analysis covered 27 separate bear and bull markets, as you can see in the post.
While the average bear market for the S&P 500 endured roughly 9.5 months (286 calendar days), the typical bull market has stuck around for 1,011 calendar days, or roughly 3.5 times as long. What's more, 13 bull markets have lasted longer than the lengthiest bear market over 94 years.
Over the short term, directional moves in the Dow, S&P 500, and Nasdaq Composite are always going to be somewhat unpredictable. Though a crash remains within the realm of possibilities, given what history tells us about stock market valuations, the historic data on stock market returns and economic growth is crystal clear that being an optimist and investing for the long haul is a winning formula.
Don’t miss this second chance at a potentially lucrative opportunity
Ever feel like you missed the boat in buying the most successful stocks? Then you’ll want to hear this.
On rare occasions, our expert team of analysts issues a “Double Down” stock recommendation for companies that they think are about to pop. If you’re worried you’ve already missed your chance to invest, now is the best time to buy before it’s too late. And the numbers speak for themselves:
- Amazon: if you invested $1,000 when we doubled down in 2010, you’d have $20,685!*
- Apple: if you invested $1,000 when we doubled down in 2008, you’d have $40,151!*
- Netflix: if you invested $1,000 when we doubled down in 2004, you’d have $360,991!*
Right now, we’re issuing “Double Down” alerts for three incredible companies, and there may not be another chance like this anytime soon.
See 3 “Double Down” stocks »
*Stock Advisor returns as of June 11, 2024
Sean Williams has no position in any of the stocks mentioned. The Motley Fool has no position in any of the stocks mentioned. The Motley Fool has a disclosure policy.
