Three stocks that can deliver up to 10% in the short term; watch out for the rising VIX
By Jigar S Patel, senior manager – equity research at Anand Rathi
The market dynamics in April were characterized by volatility, with both global and domestic factors influencing sentiment. Globally, geopolitical tensions and a downturn in US markets affected markets, while domestically, corrections in IT stocks and newsflow relating to banking added to the pressure. Despite reaching a peak of 22,794 on April 2, the Nifty 50 index faced hurdles around the 22,800 mark, failing to surpass it despite repeated attempts.
The index displayed a bearish pattern after a heavy selloff from its all-time high on May 3, with technical analysis indicating it’s trading within a rising channel, now aiming towards 22,900 – 22,950. However, the supply is expected in this zone, and the volatility index (VIX) bouncing back suggests challenges ahead. On the downside, a breach below 22,300 could lead to a slide towards 22,100 – 22,000.
In the banking sector, while heavy supply impacted Kotak Mahindra Bank, stocks like ICICI Bank drove the Nifty Bank to new highs, surpassing 48,636 and aiming towards the milestone of 50,000. However, this level presents a significant hurdle, coinciding with resistance from a rising channel.
Hurdles at 49,600 / 50,000 / 50,600 are expected, while breaching 48,500 could lead to further downside pressure on Nifty Bank. With elections results nearing, caution is advised as choppy momentum is anticipated in the coming weeks.
Here are three buy calls for the next 2-3 weeks:
Dr Reddy’s Laboratories: Buy | LTP: Rs 6,349.55 | Stop-Loss: Rs 6,111 | Target: Rs 6,700 | Return: 5.5 percent
Dr Reddy’s Labs shows a strong uptrend with higher highs and higher lows on a weekly scale, indicating sustained upward momentum and bullish sentiment. Recent trading saw support at the middle Bollinger band, suggesting a potential rebound.
The stochastic oscillator remained resilient, avoiding oversold conditions, and showing a bullish crossover near 25 levels on the weekly scale. This alignment suggests a favourable moment for traders to consider long positions, with entry recommended between Rs 6,275-6,350 for a projected upside target of Rs 6,700. To manage downside risk, a stop-loss near Rs 6,111, based on daily closing prices, is advised.
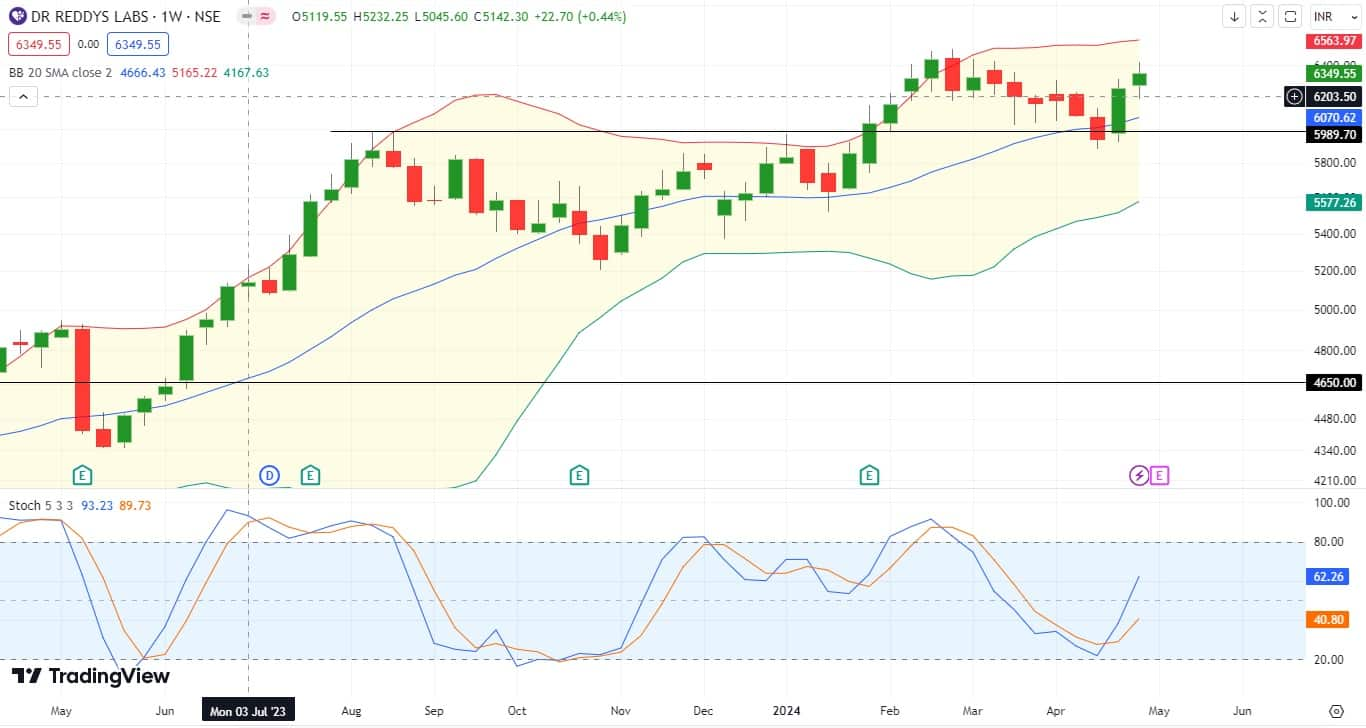
Image304052024
Piramal Enterprises: Buy | LTP: Rs 962 | Stop-Loss: Rs 902 | Target: Rs 1,060 | Return: 10 percent
Currently, PEL has found support at the 0.618 percent retracement level from its previous upward movement between April 3, 2023 and September 11, 2023. Before this, it consolidated within the range of Rs 820-900 for approximately a month.
On the indicator side, weekly stochastics exhibit regular bullish divergence on a weekly scale, suggesting a favourable buying opportunity. Hence, initiating long positions within the range of Rs 945-965 with an upside target of Rs 1,060 is recommended. A stop-loss near Rs 902, based on daily closing prices, is advised to manage potential downside risk.
NOTE: If the price is making lower lows (LL), but the oscillator is making higher lows (HL), this is regular bullish divergence
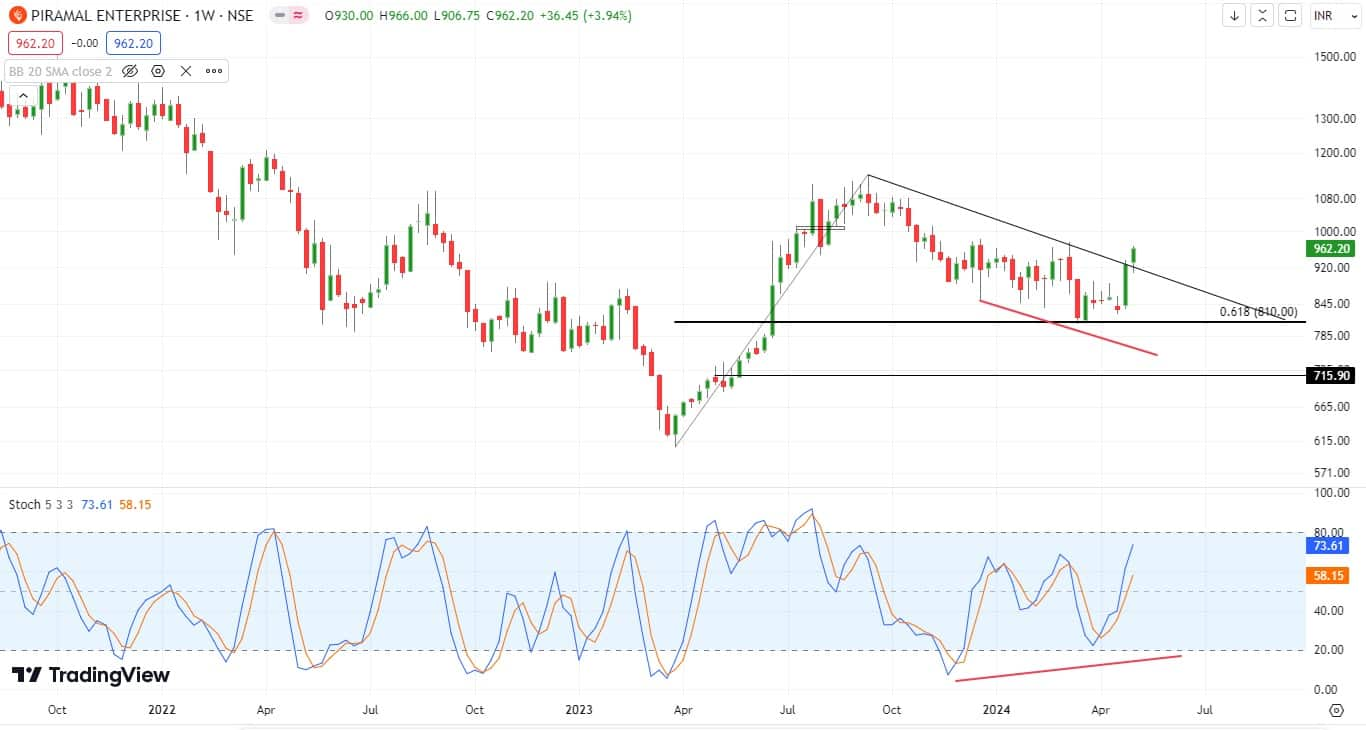
Image404052024
Cipla: Buy | LTP: Rs 1,425 | Stop-Loss: Rs 1,345 | Target: Rs 1,555 | Return: 9 percent
Cipla demonstrates a robust uptrend, marked by higher highs and higher lows on a weekly scale, signalling sustained upward momentum and bullish sentiment. Recent trading sessions found support at the middle Bollinger band, hinting at a potential rebound.
Additionally, the stochastic oscillator showed resilience and indicated hidden bullish divergence, along with a bullish crossover, further reinforcing the bullish outlook. This alignment presents a favourable opportunity for traders to consider long positions, with an entry suggested between Rs 1,400-1,430 and a projected upside target of Rs 1,555.
To manage downside risk, a stop-loss near Rs 1,345, based on daily closing prices, is recommended.
NOTE: If the price is making higher lows (HL) but the oscillator is making lower lows (LL), this is seen as a hidden bullish divergence.
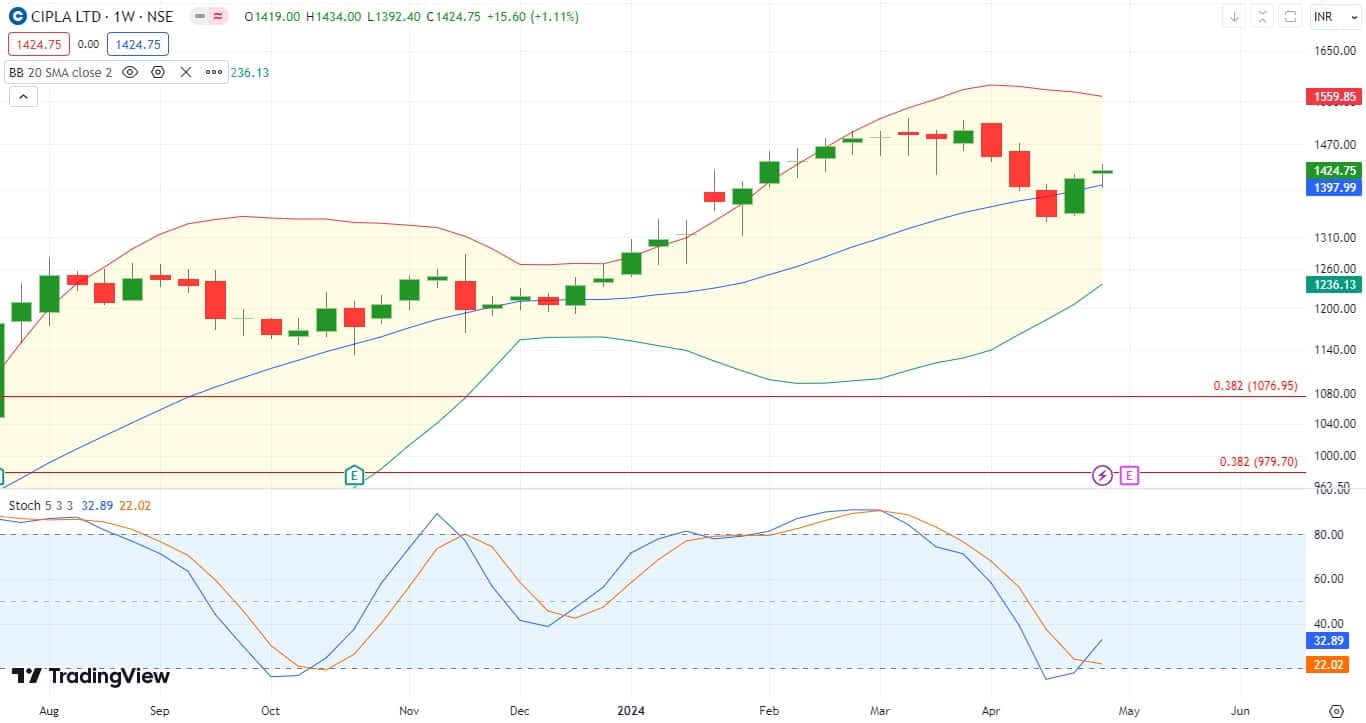
Image504052024
Disclaimer: The views and investment tips expressed by investment experts on Moneycontrol.com are their own and not those of the website or its management. Moneycontrol.com advises users to check with certified experts before taking any investment decisions.