A(tough)pril to swallow is saved by another brilliant Mariners rotation
A(tough)pril to swallow is saved by another brilliant Mariners rotation
If you’ve ever felt that the Seattle Mariners are a particularly slow starting ballclub, you’re right. And you’re wrong. Like any good dataset, there’s something conclusive for everybody in the March+April numbers for the M’s, which are worthy of scrutiny given the extraordinary performance by their grip full of aces in the rotation, as well as the extraordinary (derogatory) display by their lineup. I’m skeptical of any “that’s so Mariners” generalizations, but one such trope trotted out through the sluggish early days of this first month is that the M’s struggle to start quick, as well as an auxiliary variation lamenting their offensive woes in the early going of the season. Is it the park? Poor preparation in transitioning from Arizona? A curse? No, it is what I tell you it is, and no other possibility.
Since 2000, which is to say the first season T-Mobile Park née Safeco Field became the Mariners’ full-time home park, the M’s are 316-293 in April, a hearty .519 winning percentage that is 8th-best in MLB in that time. That number is skewed of course by the 2001 club, who won 80% of their 25 tilts, but they could all the same. Lest you fear it’s all tilted towards the rosy start to the 21st century, in the 24 years since Seattle transitioned to an outdoor park, they have had a winning record in 11 seasons, exactly .500 in two, and a losing record in 11 seasons. Sample sizes, they have their moments in the sun!
In terms of recency, the 00-03 clubs all do come up positive, as do the ‘16, ‘18-19, ‘21-22, and ‘24 clubs in the Jerry Dipoto era. Only twice, in 2014 and 2023, have the M’s salvaged a winning record from a year where their season’s first month left them looking up at .500. Thankfully, as with the M’s three other playoff appearances since Y2K, 2024 is off to a winning start, and there appears to be no major trend for the club’s overall outcomes to open the season. But what about on either side of the ball?
Starting with the obvious, the M’s rotation has been astounding. 18 earned runs in the last 18 games is a number difficult to wrangle. While the M’s are only 3rd in fWAR and 5th in RA/9-WAR per FanGraphs, their 21.6% K-BB% is currently apace for the 3rd-best ratio this millennium, trailing only the 2019 Houston Astros who were carried by two aces in Gerrit Cole and Justin Verlander, along with the extraordinary 2021 Los Angeles Dodgers rotation which featured four Cy Young winners. Those clubs won 107 and 106 games respectively, which I would not begrudge the 2024 Seattle Mariners if they chose to emulate.
It shouldn’t be astonishing that this is a trend for the M’s. T-Mobile Park has for ages been an extremely challenging place to hit, with park factors among the most punishing in the sport. This has persisted despite moving in the fences around a decade ago, as the park became a bit more homer-friendly but retained the inexorable blessing and curse experienced by any individual who is exceptionally planful: overreliance by those less forward thinking. Despite the coldest temperatures on average for home games year after year due to the nigh impossibility of a rainout, the M’s play more low-40s, rainy games each spring than their contemporaries.
Since 2000, Seattle’s pitching staff overall has the 7th-lowest ERA of any club in the first month of the season, with the clubs ahead of them (LAD, STL, NYM, ATL, NYY, & BOS) all among the most perpetually competitive/dominant clubs in the past 25 years, as well as the Mets who’ve played in two home parks with pitcher-friendly factors much like Seattle. While this April’s brilliance in the rotation is at a record-testing pace, Seattle’s pitchers are 8th as well in the past 25 years of K-BB to open the season. Nothing too surprising here – a pitcher-friendly park, cold wet air that suppresses hard hit contact, sea level to ensure the air gains no thinning properties from greater elevation. Statcast data only stretches back to 2008, but for what it’s worth Seattle ranks in about those 7th-8th slots in most key areas yet again, such as wOBA allowed and Pitcher Run Value accrued. Essentially, whether you count the best teams in franchise history or not, the M’s have perpetually been a good bet to keep opponents off the scoreboard in the season’s first month.
When it comes time to wield their own lumber, however, the soggy wood of winter appears to stick with Seattle. In March/April, since 2000, the M’s offense is 24th in MLB in batting average and OPS, 22nd in ISO, 15th in strikeouts, 17th in walks, and 27th in BABIP. It is at this point that it’s important to remember that for most of the history of the sport (and of our 25 year sample size), half the league had essentially an automatic out in their lineup 3-4 times a night in the form of pitchers hitting, so the M’s are likely in fact lower than at least the Expos/Nationals and Marlins, and may well be lesser than the Padres and Pirates, albeit still just above the Royals and Athletics. Though the existence of pitchers with bats should be a credit to some of the numbers relative to their peers for past M’s clubs, it’s nothing but an indictment on the club’s struggles in the first month at the dish.
Again turning to Statcast, Seattle fares little better with a wOBA at a dismal 25th in MLB since 2008, especially given more than a decade of NL clubs punting plate appearances still remains in the sample size, which is where four of their five trailers hail from (thank you Oakland for securing the cellar). Where the M’s are superlative is in the gap between expected weighted on-base average (xwOBA) and their actual wOBA, with a -.016 separation that means Seattle gets the worst results on their performance of any club, as their xwOBA is 13th in MLB over this lengthy stretch. The M’s are not always bad to start the year, but they do almost always struggle to hit, likely for many of the same reasons their pitching staff thrives!
We’ll close though with a trickier nut to crack: what about all the strikeouts? Seattle’s 28.7% strikeout rate as a team is basura and I mean grande. It’s not the worst in the Statcast era, thanks to the 2021 Detroit Tigers and their 30.6% strikeout clip, but it’s not better than anyone else! Given historical trends, this is all but certainly the second-whiffiest opening month to a season in MLB history. Is it simply meteorological trends? The batter’s eye? Poseimee himself? Beyond that pitching is more overpowering than it ever has been thanks to the sheer depth of arms allowed in every bullpen, the M’s have stood out in their fanning. Whatever it may be that’s had even some of Seattle’s more typically adept hitters whiffing at an elevated clip, particularly after a winter where the club claimed to be emphasizing cutting down on swinging and missing, it’s made for tough sledding.
Say, I wonder who the team with the lowest strikeout rate in March/April is since Statcast started going, and whether they lost 101 games?
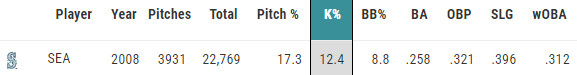
Oh. Perhaps we’ll be alright.